Thread Rating:
  • 0 Vote(s) - 0 Average
  • 1
  • 2
  • 3
  • 4
  • 5
EORMC: BTC Holds Above the USD 70,000 Cost Zone, While ETF Fund Flows Provide Market
#1
[Image: t8uovx8x.png]

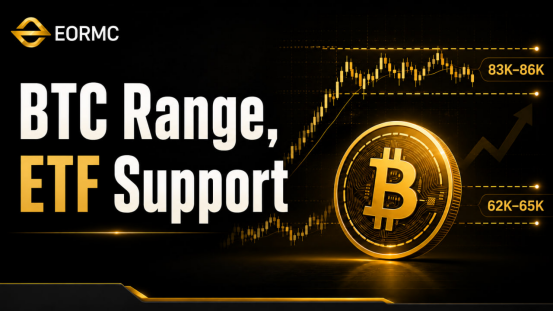
The short squeeze in mid-August pushed Bitcoin back above USD 80,000, and the current market has formed a relatively clear upper and lower range: a large number of potential short liquidation positions are concentrated between USD 83,000 and USD 86,000 on the upside, while a dense long liquidation zone exists around USD 63,000 on the downside. EORMC analysis indicates that short-term volatility is not yet sufficient to confirm that the market trend has weakened. Instead, it is more likely that the market is digesting chips again after the previous rapid rebound. ETFs continue to record fund inflows, while the on-chain cost basis also provides a new reference point for market observation.

USD 83,000 to USD 86,000 Becomes a Repricing Zone for Bulls and Bears

After Bitcoin broke above USD 80,000, it failed to form a direct and sustained upward move. One of the core reasons is the relatively concentrated long-term supply above. The USD 83,000 to USD 86,000 range is not only a price resistance zone, but also an area where a large number of short positions may be triggered for liquidation. If the market can achieve an effective breakout with expanded trading volume, short covering may further strengthen price momentum. Conversely, repeated resistance in this area also shows that the market still needs more spot buying to complete chip digestion. At the current stage, it is more appropriate to observe the conditions for a breakout rather than simply predict a one-sided rise. Mature markets often need sufficient turnover to complete new price discovery, and consolidation itself can also reduce excessive leverage, creating a healthier structure for the formation of the next-stage trend.

The USD 71,000 Cost Basis Has Risen, and the Support Zone Is Becoming Clearer

On-chain data shows that the redistribution of chips during the summer is changing the market cost structure. When BTC was near USD 78,000 in May, approximately 65% of the supply was in profit. After returning to a similar price level at the end of August, the proportion of profitable supply rose to approximately 68%. At the same time, the cost basis of short-term holders has increased to around USD 71,000. This means that more and more capital has changed hands at higher prices, making the area near USD 70,000 a new psychological and cost reference for the market. Further below, the USD 62,000 to USD 65,000 range has formed an obvious accumulation area. For traders, a rising cost basis is a positive phenomenon because it indicates that the average market holding price is increasing. However, the increase in profitable chips may also create phased selling pressure. The platform will continue to help users understand these changes through on-chain data, price structure, and risk indicators, rather than relying only on short-term price movements to judge direction.

ETFs Maintain Net Inflows, While Professional Capital Continues to Absorb Supply Under Macro Pressure

The seven-day average net inflow of U.S. spot Bitcoin ETFs once reached USD 290 million per day during the rebound phase, indicating that institutional channels are still providing real buying demand. Although the daily trading volume in the secondary market is approximately USD 3 billion, lower than during the previous rapid expansion phase, capital has not fully withdrawn from the market. Meanwhile, the U.S. 10-year Treasury yield has risen again to around 4.8%, reflecting that fiscal and interest-rate pressures will continue to affect the valuation of risk assets. In such an environment, the ability of Bitcoin to maintain its main cost zone above USD 70,000 shows that the market has a certain degree of absorption capacity. EORMC will continue to strengthen liquidity for mainstream assets, trading execution, intelligent risk control, and institutional services, enabling users to have a more stable trading foundation in an environment where high volatility and macro uncertainty coexist.

BTC currently remains within a broad structure between USD 62,000 and USD 86,000. The key short-term observation areas are concentrated around the USD 71,000 cost basis and the upper supply zone between USD 83,000 and USD 86,000. Continuous ETF fund inflows provide support for the market, while the rise in on-chain cost basis also shows that capital is rebuilding positions at higher prices. EORMC will continue to support market activity through data research, liquidity development, and risk management, providing a more stable trading environment for the next stage of directional selection.
Reply
#2
When reading discussions about Bitcoin prices, I think it is important not to focus too much on one specific number without looking at the wider market context. A price level such as $70,000 can attract a lot of attention, especially when it appears in headlines or social media discussions, but the price itself is only one part of the bigger picture. Bitcoin can move quite quickly, and short-term changes can be influenced by many different factors at the same time.
Liquidity is one thing worth considering. When there is more money moving through the market, relatively small changes in buying or selling activity can sometimes have a noticeable effect on price. Investor sentiment also matters, since periods of optimism or uncertainty can influence how people react to market news. Trading volume, institutional activity, and overall demand can provide additional context when trying to understand why Bitcoin is moving in a particular direction.
Fund flows are another factor that often comes up in discussions. ETF activity, for example, can give some indication of how certain investors are approaching Bitcoin exposure. At the same time, I would not treat ETF inflows or outflows as the only explanation for a price movement. Crypto markets are affected by several overlapping factors, and it is difficult to understand the whole situation by looking at one metric in isolation.
For anyone trying to keep track of Bitcoin's current value in US dollars, it can also be useful to look at the actual USD-to-BTC conversion rather than relying only on rounded figures from news articles. The https://paybis.com/usd-to-btc/ can be useful for checking the relationship between the two currencies and seeing how much BTC corresponds to a particular amount of USD.
Personally, I find it more useful to compare several indicators at once. Price, trading activity, liquidity, fund flows, and broader market sentiment can each tell you something different. None of them can explain every movement on its own, but together they can provide a more complete picture of what may be happening in the Bitcoin market. This approach also helps avoid drawing conclusions from a single headline or sudden price change.
Reply
#3
One thing I’ve learned from dealing with crypto transactions is that getting a transaction confirmed on the blockchain doesn’t necessarily mean the funds will show up where you expect them to. It can be especially confusing when you’re transferring one token and planning to receive another, because there are several details that need to line up before the transfer can work as intended. Network compatibility is probably one of the easiest things to overlook, particularly when different platforms support multiple networks for deposits and withdrawals. It’s tempting to focus mainly on the wallet address and the amount being sent, but those two details alone aren’t enough to guarantee that everything will go smoothly.
Before making any transfer involving SXP and USDT, I think it’s worth taking a few extra minutes to understand the exact process and verify the requirements on both ends. Checking which network is supported, confirming that the destination accepts the intended asset, and carefully reviewing the deposit instructions can prevent a lot of unnecessary stress later. Even a small difference in network selection can cause problems, and recovering funds after an incompatible transfer may be complicated, expensive, or sometimes impossible. That’s why I prefer to double-check everything rather than rush through the transaction just to save a minute or two.
Another important point is not to assume that two assets are interchangeable simply because they can be used within the same crypto ecosystem. SXP and USDT serve different purposes, and moving between them may require an actual conversion rather than a straightforward deposit. Understanding whether a platform supports the specific trading pair or conversion route you need is just as important as checking the network. I would also review the minimum deposit requirements and any fees involved so there are no unpleasant surprises after initiating the transaction.
For anyone who is still getting comfortable with crypto transfers, having a clear explanation of these steps can make a real difference. Guides https://sxpusdt.co/ that explain what to verify before sending funds are much more useful than instructions that only describe which buttons to click. Personally, I think developing a consistent checklist is one of the simplest ways to improve transaction safety. Verify the asset, confirm the network, check the destination address, review the fees, and make sure the receiving platform supports the intended transaction. If anything remains unclear, it’s better to pause and contact the platform’s official support team before sending anything. A little preparation beforehand can save hours of troubleshooting and help protect funds from avoidable mistakes.
Reply


Users browsing this thread: 1 Guest(s)