


24 September 2026, 01:37 PM
Commodity Channel Index (CCI): Formula, Signals & Uses
Most CCI guides stop at the formula. This guide adds a worked example, its real limits, and how Pakistani commodity traders use it with live prices.
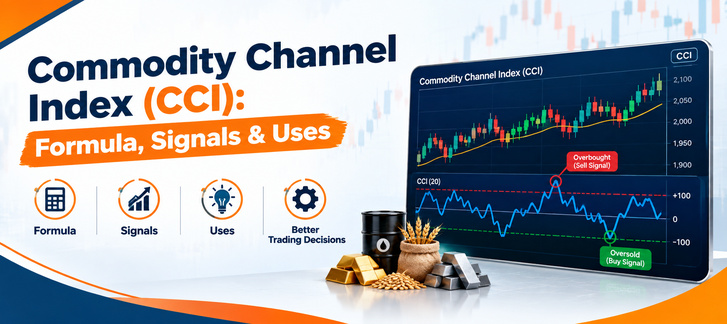
Quick answer: Donald Lambert built the Commodity Channel Index back in 1980, and at its core it's just a momentum oscillator: it tells you how far a commodity's price has drifted from its own statistical average.
Push above +100, and you're usually looking at a strong uptrend, maybe overbought territory. Drop below −100, and it's the opposite: a strong downtrend, possibly oversold.
Funny enough, despite the name, traders don't just use this on commodities anymore; it's ended up on stock charts, currency pairs, indices, pretty much everywhere.
If you trade or procure physical commodities, at some point you've probably seen a chart with a jagged orange line bouncing between two dashed levels marked +100 and −100.
That's the commodity channel index, one of the older technical indicators still in daily use, and one that was actually built for commodities before traders
borrowed it for stocks and currencies.
This guide walks through what CCI actually measures, how to calculate it by hand, the trading strategies built around it, and where it realistically breaks down.
Towards the end, we'll also cover something most CCI explainers skip entirely: how this indicator connects to the kind of physical commodity price-watching that Pakistani buyers and traders do every day on markets like cotton, sugar, and energy.
What Is the Commodity Channel Index?
Definition: At its simplest, the CCI is an unbounded momentum oscillator, meaning it compares wherever a security's price sits right now against its average over some chosen period. Donald Lambert put it together in 1980, and the original goal was to catch cyclical turns in commodity markets.
That basic idea hasn't really changed since: price climbs well above its recent average, the CCI reading climbs with it. Price falls well below that average, the reading falls too.
Unlike bounded oscillators such as the RSI, which is capped between 0 and 100, the commodity channel indicator has no fixed ceiling or floor.
Lambert scaled the formula so that roughly 70–80% of readings fall between −100 and +100 in normal conditions, which is why those two levels became the standard reference lines for overbought and oversold behaviour.
Read More: https://zarea.com/news/commodity-channel...gnals-uses
Most CCI guides stop at the formula. This guide adds a worked example, its real limits, and how Pakistani commodity traders use it with live prices.
Quick answer: Donald Lambert built the Commodity Channel Index back in 1980, and at its core it's just a momentum oscillator: it tells you how far a commodity's price has drifted from its own statistical average.
Push above +100, and you're usually looking at a strong uptrend, maybe overbought territory. Drop below −100, and it's the opposite: a strong downtrend, possibly oversold.
Funny enough, despite the name, traders don't just use this on commodities anymore; it's ended up on stock charts, currency pairs, indices, pretty much everywhere.
If you trade or procure physical commodities, at some point you've probably seen a chart with a jagged orange line bouncing between two dashed levels marked +100 and −100.
That's the commodity channel index, one of the older technical indicators still in daily use, and one that was actually built for commodities before traders
borrowed it for stocks and currencies.
This guide walks through what CCI actually measures, how to calculate it by hand, the trading strategies built around it, and where it realistically breaks down.
Towards the end, we'll also cover something most CCI explainers skip entirely: how this indicator connects to the kind of physical commodity price-watching that Pakistani buyers and traders do every day on markets like cotton, sugar, and energy.
What Is the Commodity Channel Index?
Definition: At its simplest, the CCI is an unbounded momentum oscillator, meaning it compares wherever a security's price sits right now against its average over some chosen period. Donald Lambert put it together in 1980, and the original goal was to catch cyclical turns in commodity markets.
That basic idea hasn't really changed since: price climbs well above its recent average, the CCI reading climbs with it. Price falls well below that average, the reading falls too.
Unlike bounded oscillators such as the RSI, which is capped between 0 and 100, the commodity channel indicator has no fixed ceiling or floor.
Lambert scaled the formula so that roughly 70–80% of readings fall between −100 and +100 in normal conditions, which is why those two levels became the standard reference lines for overbought and oversold behaviour.
Read More: https://zarea.com/news/commodity-channel...gnals-uses